- Getting Started
- Get a Power BI Pro license from your CSP (Cloud Solution Partner) and install the Power BI Desktop app
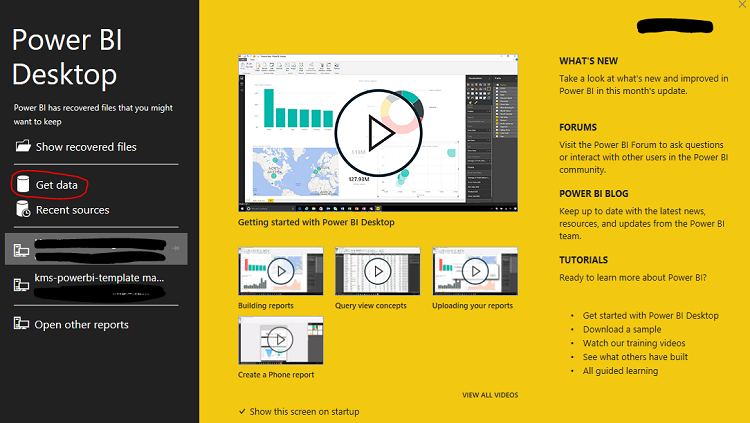
- Open Power BI app
- From the welcome screen the user can ‘Get data’ (connect to data source), access ‘Recent sources’ or ‘Open other reports’.
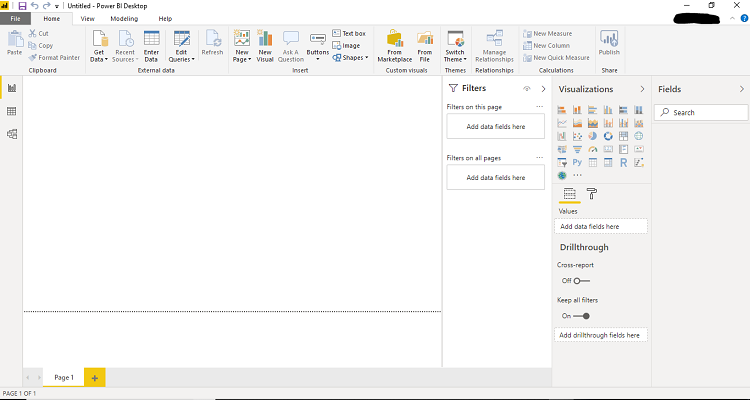
- If you close the welcome screen, you will see the report view. On the left-hand side the menu gives access to the Data view and the Relationship view.
- Connect to the ‘data’ source
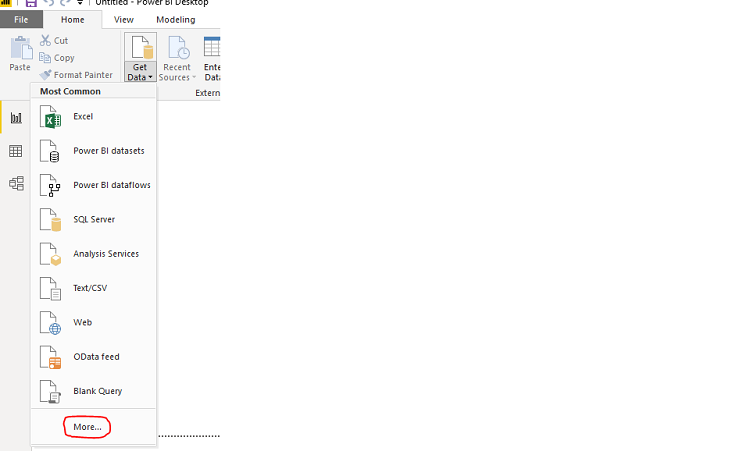
- Click on ‘Get Data’ from the top menu bar. Then click on ‘More’.
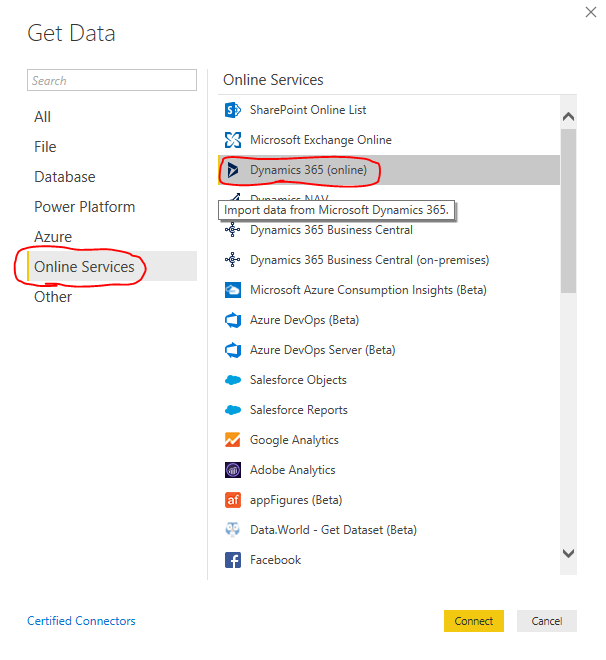
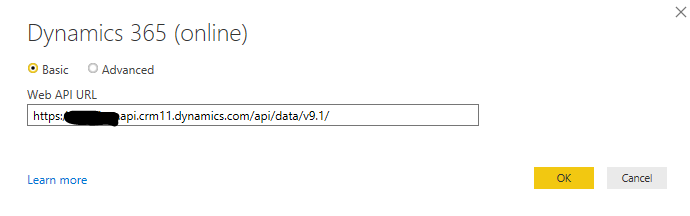
- Select ‘Online Services’ and then ‘Dynamics 365 (online)’.
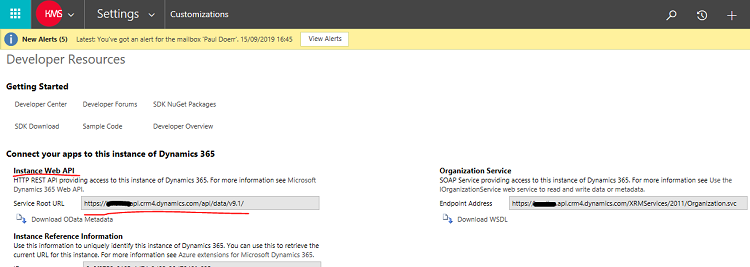
- In the prompted screen enter the ‘Instance Web API’ of your Dynamics 365 system. This can be copied from within your Dynamics 365 system | Settings | Customizations | Developer Resources |.
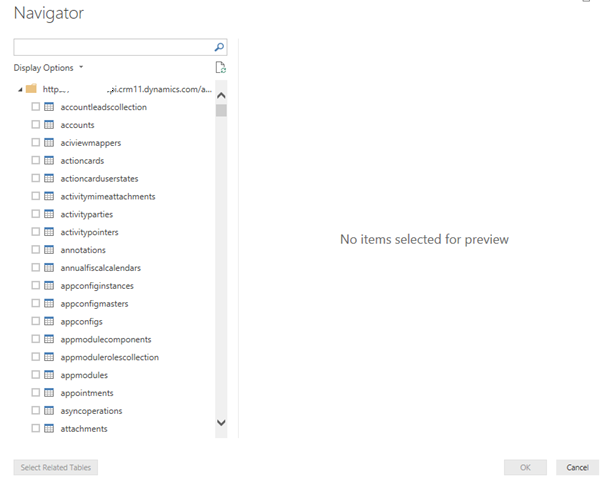
- If already signed in the navigator window opens showing available database entity tables. Select the tables then click OK.
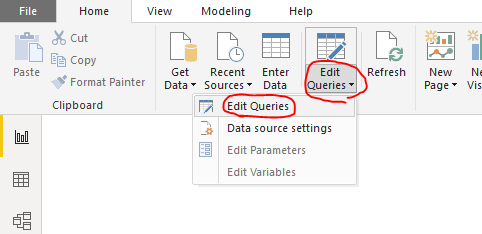
- Then ‘Edit Queries’ prior to loading the table. Load the query into Power BI Desktop by clicking on the Close & Apply
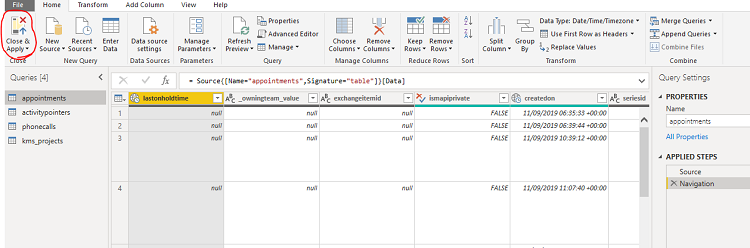
- They can then edit, tailor and shape the data by carrying out a series of transformations like removing columns (that may not be of interest) and editing headers etc. Then ‘Close & Apply’ for the changes made to be saved.
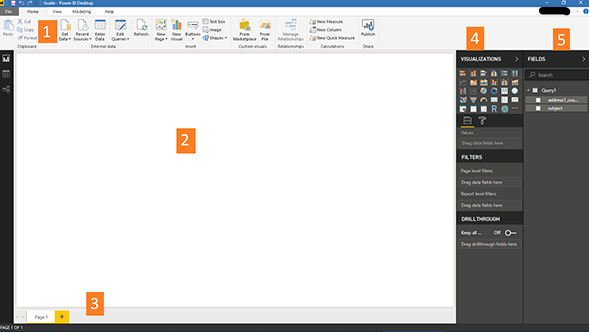
- Add visualisations and reports in the Power BI Desktop Report view. We have five key areas
- The ribbon provides access to common tasks with reports and visualisations
- The Report view or layout where visualisations (charts / grids of data) are created
- The Pages tab area where you can select or add a new page.
- The Visualisations pane, here you can change visualisations, colours or axes, apply filters, drag fields, etc.
- The Fields pane, where you can query elements and filters can be dragged into the report view, or filters can be dragged into the filters area of the visualisations pane.
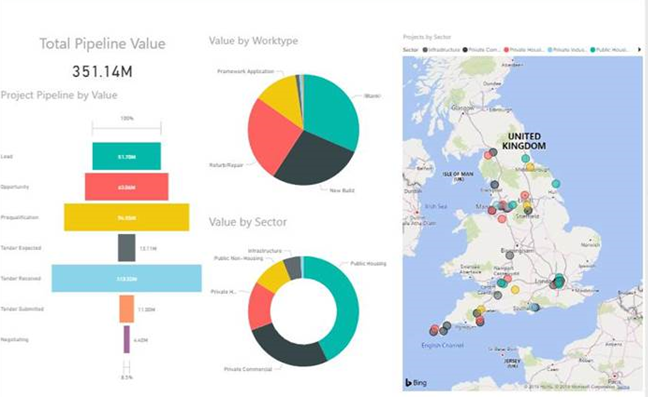
- Please see a dashboard with some visualisations that we have displaying stages of projects, the work type of the project, a breakdown of project sector and the location of these projects in the ‘UK’.
- Sharing Reports / Publishing / Inserting into Dynamics 365
- To share the report it can be saved as a .pbix file and published to the Power BI Service, the ‘Workspace’ needs to be selected.
- Once it is published to the workspace, it is the possible to login to ‘Power BI’ in the browser and the report can be shared.
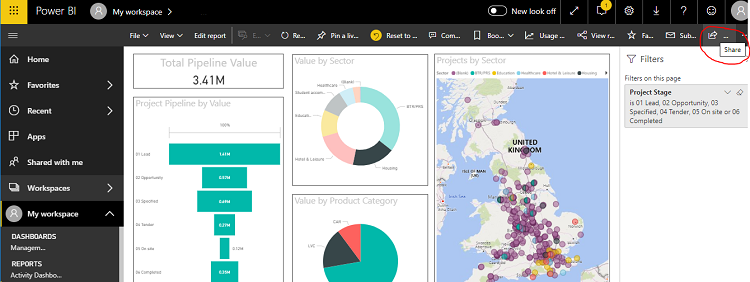
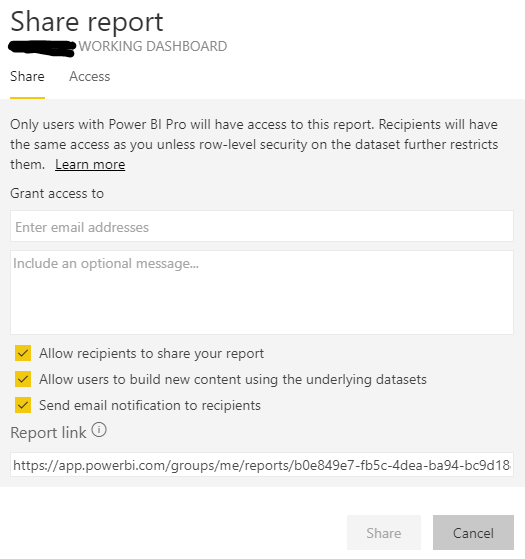
- The user you wish to share the report / dashboard with does need to have a Power BI Pro license.
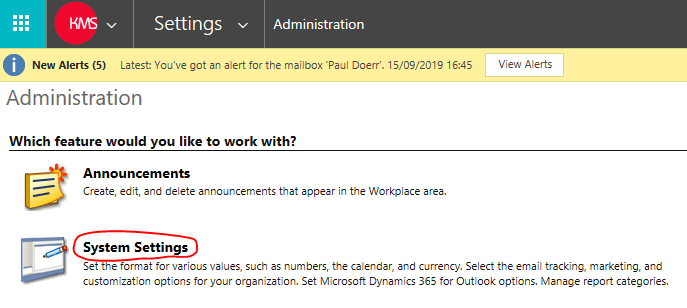
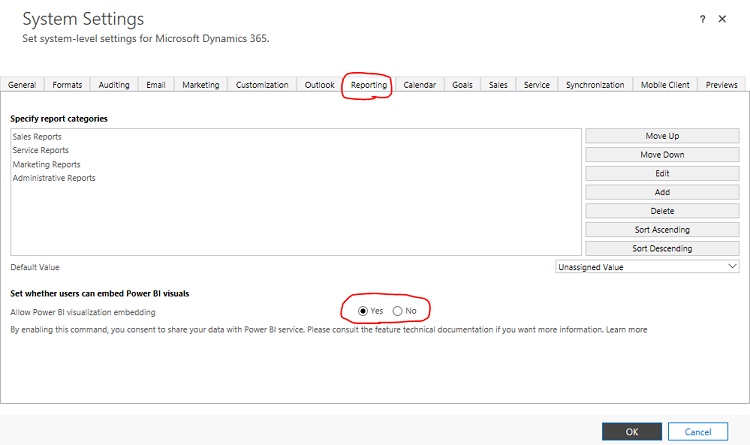
- It is also possible to share the report as a personal dashboard inside ‘Dynamics 365’. For this to be an option a system setting inside Dynamics 365 needs to be applied. Please go to | Settings | Administration | System Settings | go to the ‘Reporting’ tab and allowing embedding of Power BI visuals.
- Now when a user goes to the | Sales | Dashboards | area and clicks ‘New’ there is now an option to add a ‘Power BI Dashboard’.
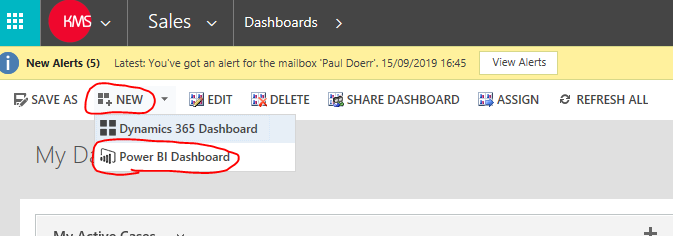
- This new Power BI Dashboard can then be shared with other CRM users in the system who have a Power BI Pro license assigned to them.